
About a month ago, I wrote a blog post explaining how malware can use process memory to its advantage, changing dramatically as it executes using ephemeral memory sections created at runtime. In that article I’ll talked about some basic memory concepts to better aid readers in understanding how programs work when they enter memory and execute.

I’m going to follow up right where we left off with our ZeroAccess Trojan called new-sirefef.exe, starting with dumping the ephemeral memory to disk for static analysis.
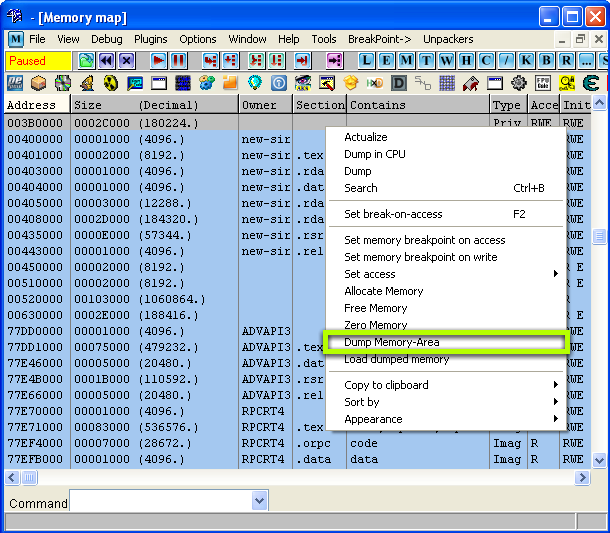
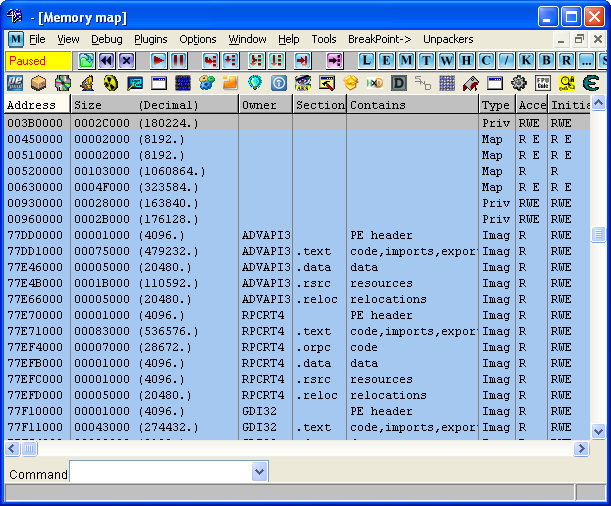
In order to dump the memory to disk for analysis, the simplest approach is to use the memory map in OllyDbg, a tool mentioned in the first part of this series. There are other ways to dump the memory, but this method will work fine for our example. Once you open the memory map you can right-click any section of memory and dump it to disk, you can give it any filename you’d like.
After saving the memory segment, you can load it up with IDA to view the code. If you recall, IDA is a powerful disassembler and debugger that is best suited for static analysis due to features like graph view and function naming. You can download a freeware version here. The freeware version is one major version behind the current release, but it still gets the job done.
Just a side note: if you’ve never used IDA before, you’ll notice some differences and similarities with OllyDbg. IDA is a more advanced tool than OllyDbg and has more to offer in terms of features and plugin support. However, I personally prefer using OllyDbg for debugging and IDA for viewing the disassembly, but not everyone would agree with that statement. This is because IDA offers a non-linear graph view for disassembly, which makes a program’s flow of execution much easier to understand. However, the debugger in OllyDbg just feels more natural and user-friendly to me than IDA’s, so I usually separate the two. Feel free to disagree, and experiment to see which you like best.
As with OllyDbg, though, I’m not going to explain how to use IDA in-depth, but fortunately for you others have done the work explaining IDA. Chris Eagle has written a great book covering everything you need to know about this powerful tool, not to mention there are dozens of Internet tutorials available. If you’re looking to be an avid reverse-engineer, familiarizing yourself with IDA is a must.
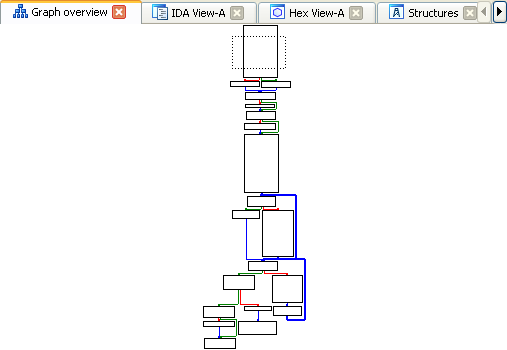
Now, back to our memory dump—even though this isn’t a Windows PE file, you can still load it in IDA to make static analysis easier using its graph mode. When loading the file, make sure you tell IDA to disassemble as 32-bit code since that’s what we’re working with.
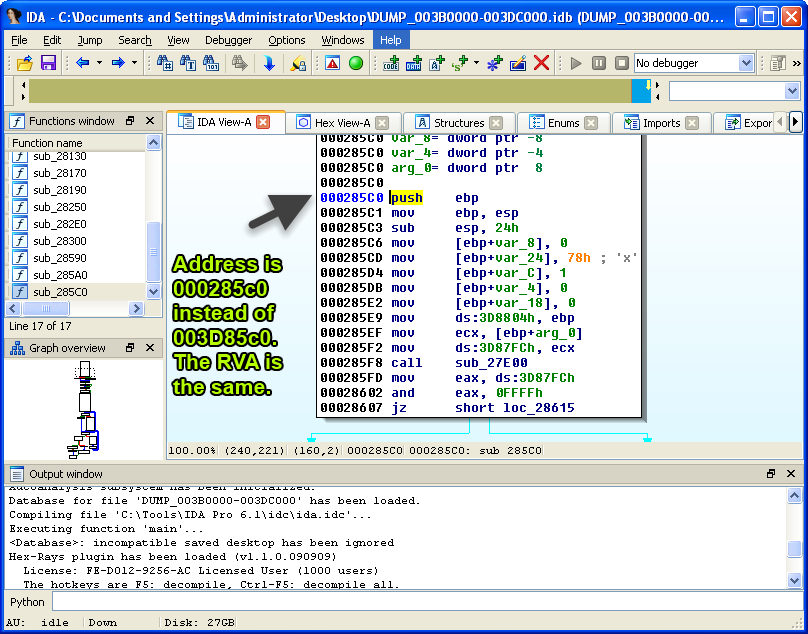
At first glance, you may notice the memory addresses in IDA don’t match the addresses you have in OllyDbg. This is because we loaded a plain memory segment in IDA, which doesn’t have the same virtual address like our PE file. A virtual address is just an address in virtual memory. As you analyze files, you’ll frequently need to convert a relative virtual address (RVA) to a file offset whenever you want to see the bytes on disk.
(click to enlarge)
Like a virtual address, an RVA is an address in virtual memory relative to the virtual offset of the memory segment. You could use the following equation to calculate an RVA.
RVA = Virtual Address – Image Base Address Example: Finding an RVA of Virtual Address 0x040146A
RVA = 0x040146A – 0x04000000 RVA = 0x146A
On the other hand, a file offset is a location in a file that’s stored on disk. To determine a file offset using an RVA, use the following equation.
File offset = RVA – Segment Virtual Offset + Section Raw Offset Example: Finding the File Offset of Virtual Address 0x40146A
File offset = 0x146A – 0x1000 + 0x0400 File offset = 0x46A + 0x400 File offset = 0x86A
Performing this calculation can get confusing very quickly, so check out an example if you need help. Understanding how to translate an RVA to a file offset and vice versa is important when trying to find where code may reside in the file on disk (provided it has changed during unpacking).
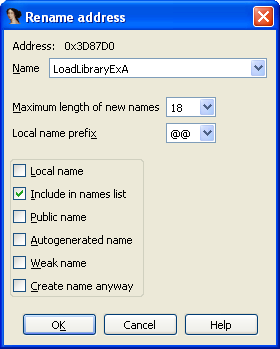
In order to make the addresses we have in OllyDbg match with IDA, we’ll need to rebase the memory segment. To do that, we’ll need to use IDA’s rebase program feature found under Edit -> Segments -> Rebase program and enter the starting address of our ephemeral memory segment, which is 0x003B0000 (see first image). This can also be referred to as the image base address.
After using the rebase program feature, our addresses will match in IDA and OllyDbg. This allows for easier navigation and less confusion when analyzing the code.

(click to enlarge)
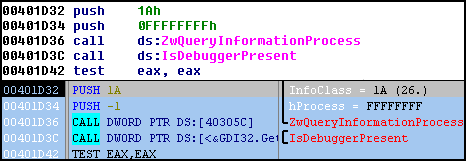
However, there are some flaws to dumping a standalone memory segment and analyzing it, the biggest being that you have no import address table (IAT). If you recall from part one of this series, the IAT is a list of functions that a program calls as it executes, usually retrieved from system libraries. The below image depicts the difference between our disassembly in OllyDbg and IDA whenever we encounter an imported function.
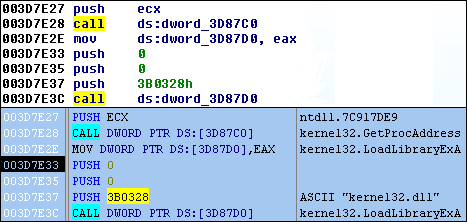
The reason the IDA disassembly is missing import information is because the code within the ephemeral memory is not a PE, and it doesn’t contain the new IAT created via runtime linking. Typically, in order to correct this issue, an analyst will have to rebuild the IAT, but we don’t need to do that for this example, at least not yet since this isn’t our final dump. For now, we can just rename memory values with function names.
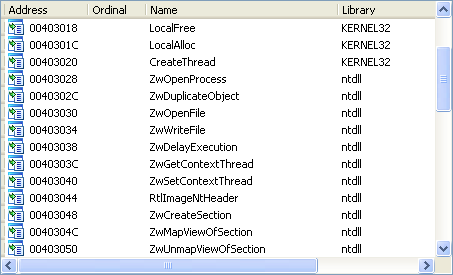
Here are the new imports created while debugging the code in my new memory segment. These will help us rename memory addresses and provide clues as to what will happen next during execution.
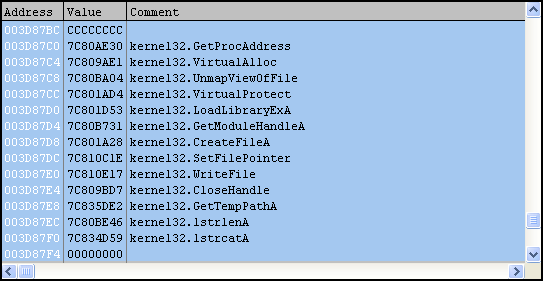
These imports are all real functions, but it appears they’re not the imports for our final unpacked Trojan. Imported functions like VirtualAlloc and especially UnmapViewOfFile are good indicators of that. If you recall from part one, the VirtualAlloc function is used to create a new memory segment, so it’s possible there is another memory jump soon. On the other hand, UnmapViewOfFile is used to “unmap” the calling process from memory (new-sirefef.exe). This is a common technique used by packers where the original file will be unmapped and replaced with a modified one, usually the unpacked file.
Looks like things are going somewhat as predicted, as our code is creating a new segment at 0x00930000 using VirtualAlloc.
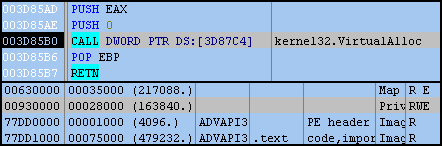
However, instead new data is copied from our current segment (0x003B0000) and placed in the new one (0x00930000). It doesn’t seem to be code as it won’t disassemble properly.
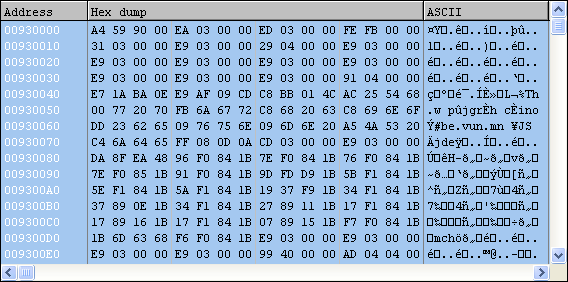
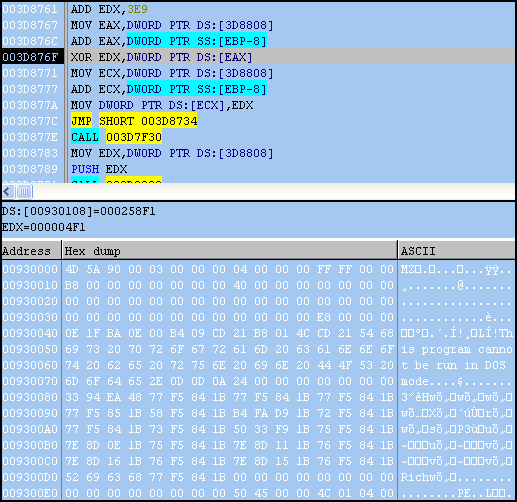
After running the Trojan further we discover the data is actually an encrypted PE file, which is then decrypted using a custom XOR routine, one DWORD at a time (Note: a DWORD is equal to 4 bytes). The decryption routine is as follows: (Note: The “^” character represents a logical XOR operation)
x ^ y = z Where:
x = (RVA + DWORD Value) + RVA y = RVA + 0x3E9 z = Decoded DWORD Value
Remember, the bytes are read in little-endian (right to left), but as humans we read them in big-endian (left to right). Example:
x = (0x0 + 0x9059A4) + 0x0 x = 0x9059A4 y = 0x0 + 0x3E9 y = 0x3E9 0x9059A4 ^ 0x3E9 = z z = 0x905A4D
(big-endian: 0x4D5A90, first two values “MZ” magic in ASCII)
At this point we can dump the memory area just like we did at the beginning of the post. Also, since this is a PE file, it should have some imports.
What’s interesting about these imports is that there are still more indicators that we’re not done unpacking. Next we’ll see that our original file is unmapped from memory, as predicted.
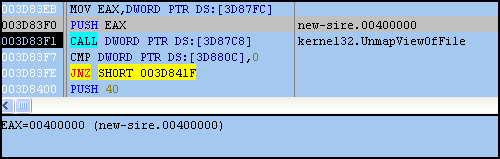
Notice how new-sirefef.exe is no longer present in the memory map after the call to UnmapViewOfFile (see first image). The virtual address space (VAS) for this process can still survive, even if the calling EXE is removed from memory.
Afterward, a new memory segment will be created with VirtualAlloc and the new PE will be copied there, restoring the original memory range for our EXE. The new PE is then executed after exiting the ephemeral memory segment. From here, we can continue to examine the new file in IDA and perform further analysis. In the image below, the Trojan tests if it’s running in 64-bit environment and also determines if a debugger is attached. Looks like we’re now one step closer to seeing what this malware is really doing.
Closing Thoughts You should now have a better understanding of how malware changes once it enters memory. To summarize, we first defined analysis tools and talked about some basic memory concepts—we elaborated on imported functions and packers, and described different levels of analysis that can be performed on malware. Afterward, we used that new information and applied it to a ZeroAccess Trojan titled new-sirefef.exe. Once we loaded the Trojan into memory, we saw how it then allocated more memory (which we dubbed “ephemeral memory”), and watched how the Trojan retrieved more imports. Finally, we saw a completely new PE was decrypted, and then we jumped out of our existing memory segment and back into a completely new file, but still having the original memory range. The file on disk completely changed once it entered memory.
I hope these two articles have been both educational and informative. I’m not going to finish analysis on this malware, but if you’re looking to try yourself, you can search for it using the following md5: EB6035F149E0FDBBDF78139159465B82. As a closing reminder, always exercise caution when dealing with live malware samples, and always examine malware in an isolated environment. Malwarebytes is in no way responsible if you inadvertently infect yourself, but you can always download our free anti-malware software should you find your ship is sinking.
_______________________________________________________________________________
Joshua Cannell is a Malware Intelligence Analyst at Malwarebytes where he performs research and in-depth analysis on current malware threats. He has over 5 years of experience working with US defense intelligence agencies where he analyzed malware and developed defense strategies through reverse engineering techniques. His articles on the Unpacked blog feature the latest news in malware as well as full-length technical analysis. Follow him on Twitter @joshcannell